Timeline
Be a Resident Assistant
Hiring complete for 2026-27. Application for 2027-28 will open in September 2026.
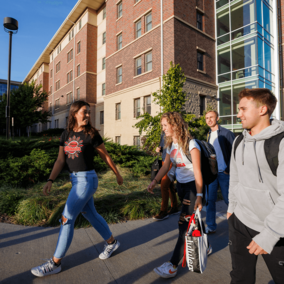
Resident Assistants (RA) are student staff members who live and work in a residence hall on campus.
RAs play a crucial role in creating a positive, supportive living environment for students. They serve as a resource and mentor, and role model for residents, helping to build community and fostering personal and academic growth.
RAs receive training and professional development to enhance their leadership, communication, problem-solving, and interpersonal skills. They work closely with Residence Life staff to maintain a positive living experience for all residents.
RA Stats
All About the Job
All About the RA Role
Benefits
As an RA, you'll cultivate lifelong leadership skills and learn to connect with diverse individuals, setting you apart in future job searches and fostering meaningful relationships. You'll also meet friends that will last a lifetime.
Requirements
- Must be a full-time undergraduate or graduate student in good standing at the University of Nebraska–Lincoln (UNL).
- Maintain a minimum cumulative GPA of 2.5 or higher (note: GPA requirements for Knoll and Kauffman RAs may differ).
- Have completed at least 24 credit hours at a university prior to the start of employment.
- Be active and in good standing as a UNL student for the duration of employment.
- Mandatory attendance at Resident Assistant (RA) training sessions in both the fall and spring semesters.
- Duty coverage is required during university breaks, continuing until the RA agreement concludes on the Sunday following spring graduation in alignment with the academic calendar.
Responsibilities
Resident Assistants (RAs) are integral members of our student staff. RAs live and work within the campus residence halls. RAs develop the community on their assigned floors by offering resources and support to residents, organizing engaging programs, handling administrative tasks, actively participating in staff meetings, and fulfilling on-call responsibilities for their respective halls. (On-call/duty responsibilities usually amount to one day per week and one weekend per month. These duties may vary depending on your staff team and schedule.)
The RA position is dynamic, in that it requires a lot of critical thinking. Students who are RAs can count on serving in a variety of different ways. Learn more by reviewing the full job description in this document (pdf). Note, this is the job description for the 2025-26 academic year; changes may be made ahead of the 2026-27 academic year.
Training
RAs undergo annual training before the academic year begins. Collaborating with campus partners, we ensure comprehensive preparation for your role, fostering a sense of community within both the department and individual hall teams. Training starts on Friday, August 7, 2026*, and concludes on the first day of the fall semester. (*Based on projected academic year calendar)
Time Commitment
The Resident Assistant (RA) position is a 19.6-hour-per-week role with responsibilities that vary from week to week. RAs are required to attend a weekly staff meeting on Wednesdays from 7–9 p.m. and hold a one-on-one meeting with their supervisor each week. In addition, RAs serve on duty one day per week and one weekend per month, with other assigned duties scheduled to align with their academic commitments and personal schedules.
Compensation
RAs receive a room, a meal plan, and a semester stipend based on years of service to the department: $600 (1-2 semesters) and $800 (3+ semesters).
Residence Life Acronyms
Here are some terms we often use in our department:
RA (Resident Assistant)
SRA (Senior Resident Assistant – someone who is in their 2nd+ year in the RA position)
ARD (Assistant Residence Director) – supervisor to RAs/SRAs
RD (Residence Director) – supervisor to RAs/SRAs
ADRL (Assistant Director of Residence Life) – supervisor of RDs/SRDs in certain areas
SSM (Student Services Manager) – Manages the front desk functions and desk staff
Application Info
Application Information for 2026-27 (Now Closed)
Application Period
Application period is September 22, 2025 through 11:59PM CST on October 22, 2025. Applications are being accepted for RA positions for the 2026-27 Academic Year.
Attend an Interview Prep Night
Attend one of the optional interview prep nights to get basic info on the RA position, Q&A, and a mock interview with feedback from our professional staff.
- Thursday, October 16, 2025 from 7:00-8:00 pm – WCDC Red Cloud
- Wednesday, October 22, 2025 from 8:00-9:00 pm – Mari’s Lounge, WCDC Red Cloud, Harper Conference Room C, and Massengale Multipurpose Room
After I apply, what happens next?
Within the application you will be asked to watch a video and answer a couple of questions. This is required as a part of the application process. After you finish the application you will be invited to sign up for a 30-minute Zoom Interview which will occur November 4th through November 21st. An optional Interview Prep Night will be held on October 16 and October 22. By attending, you’ll have the opportunity to ask questions about the position and interview process, as well as an opportunity to work on your interview skills.
Interviews & Notification
As an active candidate, you’ll need to stay connected to your Huskers email to complete necessary steps. 1st round interviews: Zoom, 2nd round: in-person.
I've interviewed. What happens next?
After your 1st round interview, you'll be notified about the 2nd round by the week of November 26. Around 100 out of 200+ candidates will advance, with a select number receiving final offers due to high competition, leading to multiple-year applicants.
Who can I contact for more information?
Contact the RA Selection Committee at unl.rlrecruitment@nebraska.edu